In the first post I covered the process of building a simple site with Angular 4 on the client and Django on the server and how to deploy it to heroku. One great benefit to use python is the huge amount of packages it has
Python is great choice for data analysis , it has some popular packages to make development very easy:
- NumPy – package for creating and using multi-dementional arrays
- Matplotlib – package for creating graphs
- Pandas – package for data handling
- Seaborn – package for data visualization , build on matplotlib
In this post I will cover the process of integrating the above packages on the server side and use it from Angular
Using NumPy
First we need to install it on our virtual environment:
(env) # pip install numpy
(env) # pip freeze > requirements.txt
Then we can add code to use numpy arrays for example – adding new view:
def getNums(request):
n = np.array([2, 3, 4])
name1 = "name-" + str(n[1])
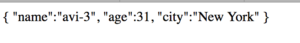
return HttpResponse('{ "name":"' + name1 + '", "age":31, "city":"New York" }')
Add url to match the view:
url(r'^getnum/$',views.Customers.getNums),
Run the server and test the result by using the url: 127.0.0.1:8000/getnum
More useful example:
We want to send list of numbers to manipulate it on server – for example calculate average: we build a simple form:
![]()
The Angular side:
HTML:
  <input type="text" [(ngModel)]='str1'>
  <button (click)="getavg()">Get Average</button>
  <input type="text" value={{resavg}}>
JavaScript:
 getavg(){
  	this._http.get("/getavg?val=" + this.str1).map(r=>r.text()).subscribe(res => this.resavg= res)
  }
The server side:
    def getAvg(request):
        s1=request.GET.get("val","")
        if len(s1)==0:
            return HttpResponse("none")
        l1=s1.split(',')
        ar=np.array(l1,dtype=int)

        return HttpResponse(str(np.average(ar)))
of course it is just an example of something you can easily do on the client but if you need something more complex (linear algebra etc.) this is the way
Using Matplotlib
Matplotlib package helps you create many types of graphs. it is based on Numpy Arrays.
Now we want to generate a graph on http request.
The first thing to do is installing matplotlib in our virtual environment:
(env) # pip install matplotlib
(env) # pip freeze > requirements.txt
Then we need to import matplotlib and also add the following command:
import matplotlib as pl
pl.use('Agg')
import matplotlib.pyplot as plt
You need to use a non-interactive backend ‘Agg’ to generate png files
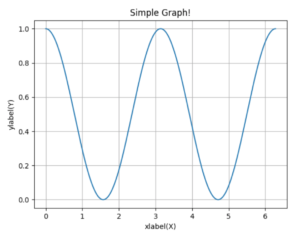
The following code generate graph as a view:
    def getimage(request):
        x = np.arange(0, 2 * np.pi, 0.01)
        s = np.cos(x) ** 2
        plt.plot(x, s)

        plt.xlabel('xlabel(X)')
        plt.ylabel('ylabel(Y)')
        plt.title('Simple Graph!')
        plt.grid(True)

        response = HttpResponse(content_type="image/jpeg")
        plt.savefig(response, format="png")
        return response
Add url for the new view and test it locally:
Load the graph from Angular code:
Add an img tag:
<img src={{imgsrc}} width="500">
Add new data member to the class and connect a button click event:
export class AppComponent {
  ...
  imgsrc='';
  getimage(){
  	this.imgsrc = '/getimg';
  }
  ...


}
Build the angular code and copy to the static folder of your app:
# ng build
# cp dist/*.js ~/projects/hello/helloapp/helloapp/static/
Using Pandas
Pandas is a great package for data analysis – one object it defines is a dataframe – a 2 dimension table with many methods act on it like SQL.
We need to install it:
(env) # pip install pandas
(env) # pip freeze > requirements.txt
Now we define a view to return a dataframe in html format:
    def getData(request):
        samp = np.random.randint(100, 600, size=(4, 5))
        df = pd.DataFrame(samp, index=['avi', 'dani', 'rina', 'dina'],
                          columns=['Jan', 'Feb', 'Mar', 'Apr', 'May'])
        return HttpResponse(df.to_html(classes='table table-bordered'))
In the above code we define a numpy array with random numbers, create a DataFrame and convert it to html. The classes we define belongs to bootstrap
Integrate With Angular
We define a span and bind the innerHTML attribute to the pandas table:
<span innerHtml={{pandas}}></span>
...

getDF()
{
   this._http.get("./getdata").map(r => r.text()).subscribe(v => this.pandas = v);
}
Using Seaborn
Seaborn helps with creating statistic graphs. It is built on Matplotlib and support some interesting graphs
Install:
(env) # pip install seaborn
(env) # pip freeze > requirements.txt
To use seaborn, we will use a CSV file taken from kaggle.com – Titanic Dataset
To load the file into pandas dataframe we need to add the file to the project files – we simply put it on the same folder as views.py
module_dir = os.path.dirname(__file__)
file_path = os.path.join(module_dir, 'titanic_train.csv')
df = pd.read_csv(file_path)
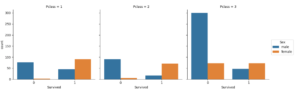
we want to see who survived group by sex and Pclass so we generate a factorplot graph:
   def getSBData(request):
        module_dir = os.path.dirname(__file__)
        file_path = os.path.join(module_dir, 'titanic_train.csv')
        df = pd.read_csv(file_path)
        gr=sb.factorplot(x='Survived', hue='Sex', data=df, col='Pclass', kind='count')
        response = HttpResponse(content_type="image/jpeg")
        gr.savefig(response, format="png")
        return response
And Again we declare img tag on Angular, bind it to class member and set it on click
This is the result:
Like the above, we can add any package we want , manipulate it on the server and make an http request from the client to load it.
Final server code(views.py):
from django.http import HttpResponse
from django.shortcuts import render
from django.views.generic import TemplateView
import matplotlib as pl
pl.use('Agg')
import pandas as pd
import os
import seaborn as sb


import matplotlib.pyplot as plt
import numpy as np

# Create your views here.
class HomePageView(TemplateView):
    def get(self, request, **kwargs):
        return render(request, 'index.html', context=None)

class LinksPageView(TemplateView):
    def get(self, request, **kwargs):
        return render(request, 'links.html', context=None)


class Customers(TemplateView):
    def getCust(request):
        name='liran'
        return HttpResponse('{ "name":"' + name + '", "age":31, "city":"New York" }')
    def getNums(request):
        n = np.array([2, 3, 4])
        name1 = "name-" + str(n[1])
        return HttpResponse('{ "name":"' + name1 + '", "age":31, "city":"New York" }')

    def getAvg(request):
        s1=request.GET.get("val","")
        if len(s1)==0:
            return HttpResponse("none")
        l1=s1.split(',')
        ar=np.array(l1,dtype=int)

        return HttpResponse(str(np.average(ar)))

    def getimage(request):
        x = np.arange(0, 2 * np.pi, 0.01)
        s = np.cos(x) ** 2
        fig,ax = plt.subplots()
        plt.plot(x, s)

        plt.xlabel('xlabel(X)')
        plt.ylabel('ylabel(Y)')
        plt.title('Simple Graph!')
        plt.grid(True)

        response = HttpResponse(content_type="image/jpeg")
        plt.savefig(response, format="png")
        return response

    def getData(request):
        samp = np.random.randint(100, 600, size=(4, 5))
        df = pd.DataFrame(samp, index=['avi', 'dani', 'rina', 'dina'],
                          columns=['Jan', 'Feb', 'Mar', 'Apr', 'May'])
        return HttpResponse(df.to_html(classes='table table-bordered'))

    def getSBData(request):
        module_dir = os.path.dirname(__file__)
        file_path = os.path.join(module_dir, 'titanic_train.csv')
        df = pd.read_csv(file_path)
        gr=sb.factorplot(x='Survived', hue='Sex', data=df, col='Pclass', kind='count')
        response = HttpResponse(content_type="image/jpeg")
        gr.savefig(response, format="png")
        return response
urls.py
from django.conf.urls import url
from first import views

urlpatterns = [
    url(r'^$', views.HomePageView.as_view()),
    url(r'^links/$' , views.LinksPageView.as_view()),
    url(r'^getcust/$',views.Customers.getCust),
    url(r'^getnum/$',views.Customers.getNums),
    url(r'^getimg/$', views.Customers.getimage),
    url(r'^getdata/$', views.Customers.getData),
    url(r'^getsbdata/$', views.Customers.getSBData),
    url(r'^getavg/$', views.Customers.getAvg),

]
Client side HTML:
<div style="text-align:center">
  <h1>
    Welcome to {{title}}!
  </h1>
  <button (click)="click1()" >click me</button>
  <input type="text" [(ngModel)]='str1'>
  <button (click)="getavg()">Get Average</button>
  <input type="text" value={{resavg}}>
  <button (click)="getimage()">load graph</button>
  <button (click)="getDF()">load table</button>
  <button (click)="getsbimage()">seaborn graph</button>
  <br/>
</div>
<img src={{imgsrc}} width="500">
<h2>Test App: {{c1.name}}</h2>
<span innerHtml={{pandas}}></span>
<img src={{imgsbsrc}} width="1000">
TypeScript
import { Component } from '@angular/core';
import {Http, Response} from '@angular/http';
import {Observable} from 'rxjs';
import 'rxjs/add/operator/map';


@Component({
  selector: 'app-root',
  templateUrl: './app.component.html',
  styleUrls: ['./app.component.css']
})
export class AppComponent {

  constructor(private _http:Http) {
    this.c1.name = "eli"
   }
  title = 'app';
  imgsrc='';
  pandas='';
  imgsbsrc='';
  str1='';
  resavg='';
  getimage(){
  	this.imgsrc = '/getimg';
  }
  c1:Cust = new Cust();
  click1(){
    this.getAllBooks().subscribe(b => this.c1 = b)

  }
  getavg(){
  	this._http.get("/getavg?val=" + this.str1).map(r=>r.text()).subscribe(res => this.resavg= res)
  }
  getDF(){
    this._http.get("./getdata").map(r => r.text()).subscribe(v => this.pandas = v);
  }
  getAllBooks()
  {
    return this._http
          .get("./getcust")
          .map(r => <Cust>r.json())

  }
  getsbimage()
  {
  	this.imgsbsrc = '/getsbdata';
  }
}

export class Cust{
    name:string;
    age:number;
    city:string;
}
You can see the final result here
2 thoughts on “Angular and Django – Adding NumPy, Pandas, Matplotlib and Seaborn”
Comments are closed.
[…] For integrating data packages – numpy, spicy, pandas and more see this post […]
[…] Integrate with NumPy, Matplotlib and Pandas […]