One of the simplest models of machine learning is linear regression
When there is a linear relationship between the features and the target variable, all we need to find is the equation of the straight line in the multidimensional space
For example, we have real estate sales data: apartment size, floor, area code, distance from school and our goal is to estimate the property price
If we found that this is a linear problem then all we need is to find the coefficients and the intercept, that is:
Price = [Apartment Size] * a1 + [Floor] * a2 + [Area Code] * a3 + [Distance from school] * a4 + intercept
It is a supervised learning problem so we have some real data to build the model from:
| Apartment Size | Floor | Area Code | Distance from school | Price |
| 120 | 2 | 1 | 2 | 230000$ |
| 100 | 1 | 2 | 1 | 170000$ |
| …. | … | … | … | … |
Linear regression algorithms:
There are many ways to find the coefficients and the intercept, you can use least squares or one of the optimisation methods like gradient decent
In this post we will use least squares:
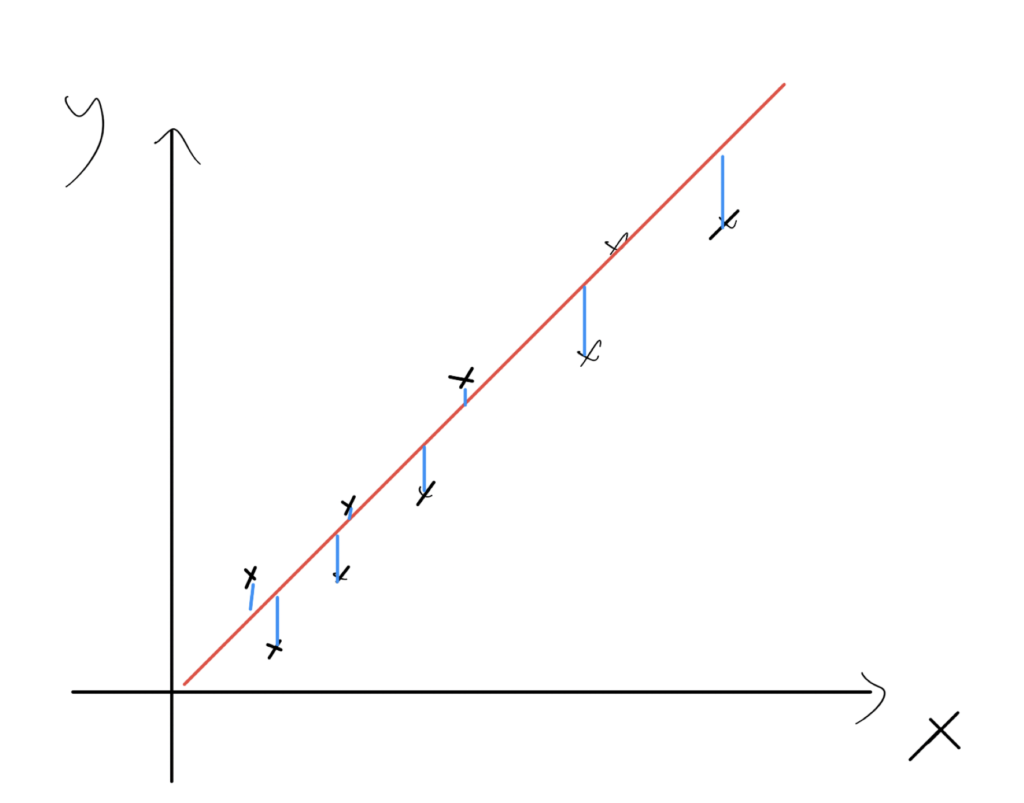
Least Squares
Least Squares is method a find the best fit line to data. It uses simple calculus and linear algebra to minimize errors:
Lets start with a simple example with 2 dimensions only. We want to find the equation:
Y = mX + b
We have a set of (x,y) pairs, to find m and b we need to calculate:
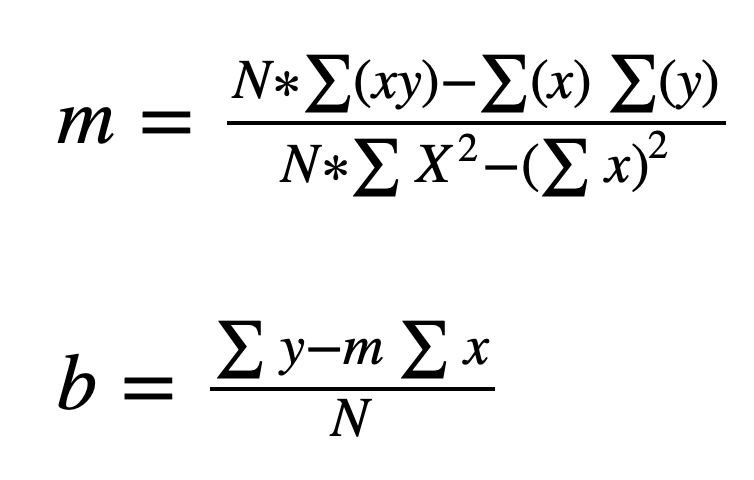
ֿ
We will use python and Numpy package to compute it:
import numpy as np
import matplotlib.pylab as plt
Create a simple test data:
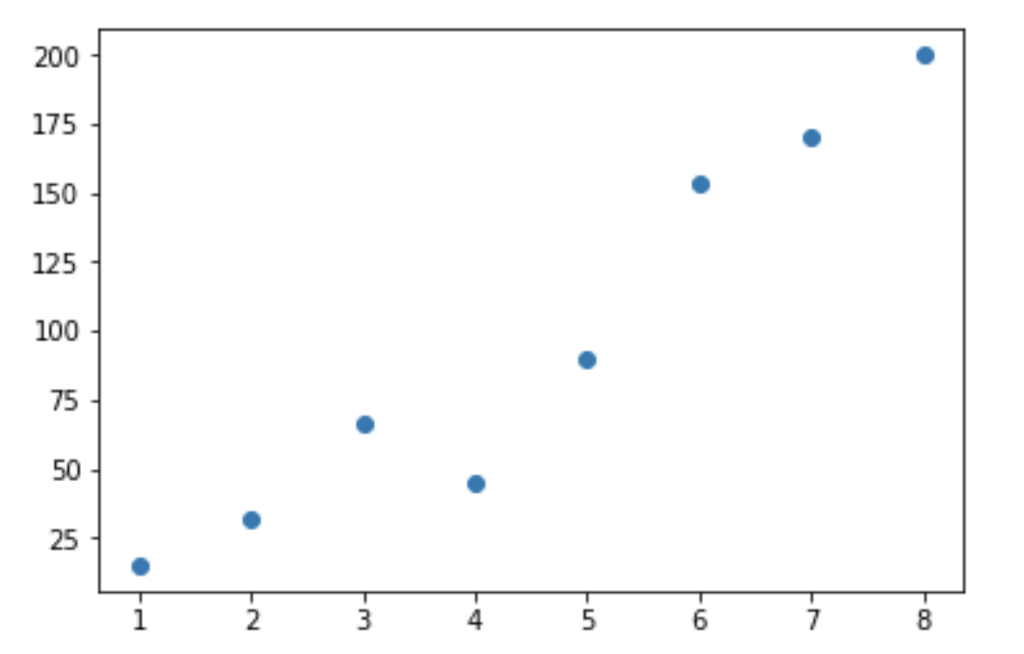
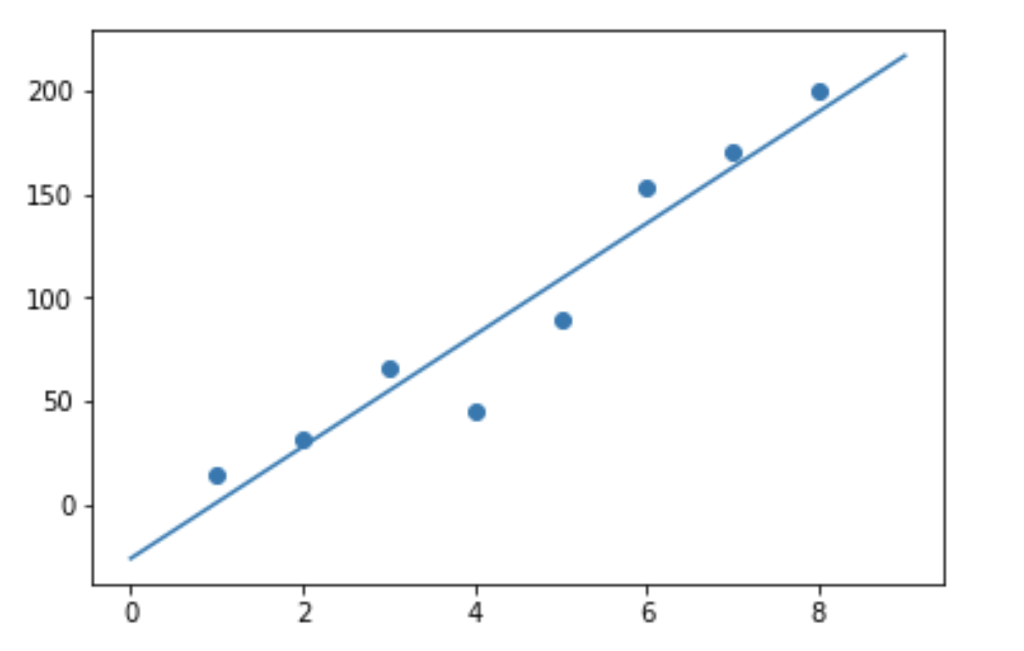
x = np.array([1,2,3,4,5,6,7,8])
y = np.array([15,32,66,45,90,153,170,200])
Visualising the data:
plt.scatter(x,y)
Compute the slope (m):
m = (len(x) * np.sum(x*y) - np.sum(x) * np.sum(y)) /
        (len(x)*np.sum(x*x) - np.sum(x) ** 2)
Compute the bias (b)
b = (np.sum(y) - m *np.sum(x)) / len(x)
print the results:
>>> print(m)
27.273809523809526

>>> print(b)
-26.35714285714286
So we can write our predict function:
def predict(x):
    return 27*x - 26
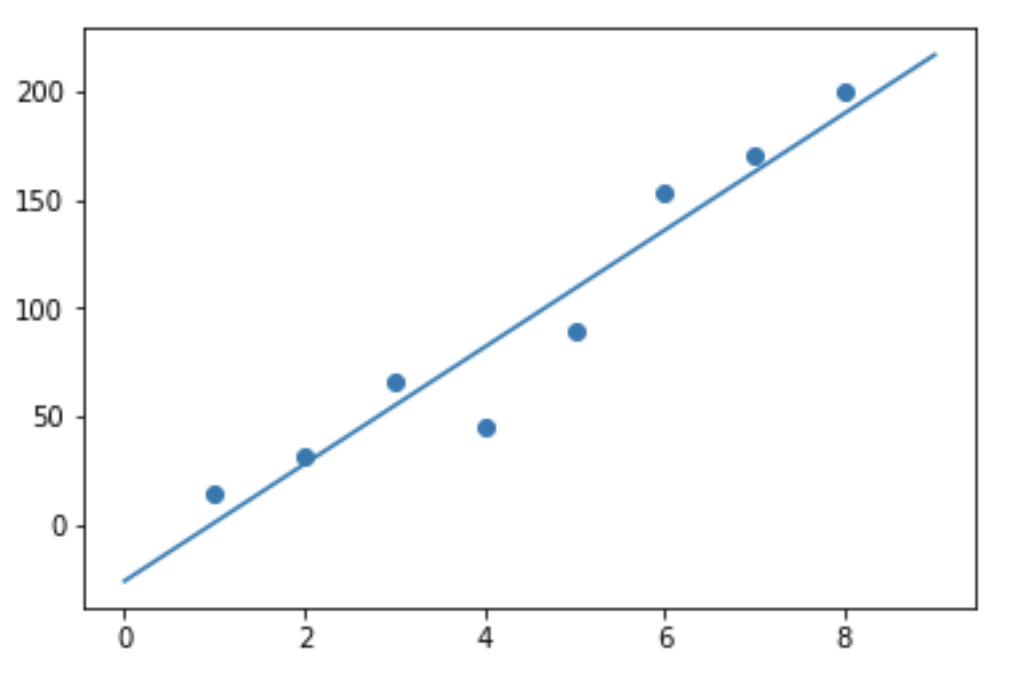
Lets draw a graph to see the best fit line:
vec = np.arange(10)
plt.scatter(x,y)
plt.plot(vec,predict(vec))
Now lets write a function to generate linear regression model based on 2 vectors
use a closure to generate a function dynamically:
def getlinear(x,y):

    def inner(x1):
        return m * x1 + b

    m = (len(x) * np.sum(x*y) - np.sum(x) * np.sum(y)) / (len(x)*np.sum(x*x) - np.sum(x) * np.sum(x))
    b = (np.sum(y) - m *np.sum(x)) / len(x)
    return inner
Now if we have 2 vectors X,Y and we want to create a linear model we use it:
predict = getlinear(x,y)
The return value is the prediction function:
>>> y1 = predict(4)
>>> print(y1)
82
Draw a graph:
plt.scatter(x,y)
plt.plot(x1,predict(x1))
Adding variables
We can use least squares with any number of variables. For example with 2 features:
F = a1*X1 + a2*X2 + b
To generate the model:
a1 = (np.sum(X2*X2)*np.sum(X1*Y) - np.sum(X1*X2)*np.sum(X2*Y))/ \
        (np.sum(X1*X1)*np.sum(X2*X2)-np.sum(X1*X2)*np.sum(X1*X2))
a2 = (np.sum(X1*X1)*np.sum(X2*Y) - np.sum(X1*X2)*np.sum(X1*Y))/ \
        (np.sum(X1*X1)*np.sum(X2*X2)-np.sum(X1*X2)*np.sum(X1*X2))
b = np.mean(Y) - a1*np.mean(X1) - a2*np.mean(X2)
3 thoughts on “Linear Regression With Numpy”
Comments are closed.
Nice overview
Hi,
Very clear concepts.
I have a doub. when you are using this (vec = np.arange(10))
Why are you using ´10´?
The arrange have 8 values.
really thanks.
Very nicely written example! Thank you.