Every Linux C/C++ developer is familiar with the message “Segmentation fault (core dumped)” , It can happen by accessing wrong memory address, making a floating point error and more.
To find out the problem, you need to enter debug mode or use the core dump
Post mortem – core dump
While the program is loading , the system arrange the process memory, put the code in .text section, initialized data in .data section and uninitialized data in .bss. It also map pages for stack and heap and for every shared object. You can configure the system to dump all this information to a file
The information includes:
- .data section at the crash point
- .bss section
- heap
- stack
- registers values
- stack trace
- and more
To create such file run:
# ulimit -c unlimited
Now after crashing you can find a file core in the directory and load it with your application to the debugger to see the problem:
$ gdb ./app ./core
GNU gdb (Ubuntu 7.11.1-0ubuntu1~16.5) 7.11.1
Copyright (C) 2016 Free Software Foundation, Inc.
License GPLv3+: GNU GPL version 3 or later <http://gnu.org/licenses/gpl.html>
This is free software: you are free to change and redistribute it.
There is NO WARRANTY, to the extent permitted by law.  Type "show copying"
and "show warranty" for details.
This GDB was configured as "x86_64-linux-gnu".
Type "show configuration" for configuration details.
For bug reporting instructions, please see:
<http://www.gnu.org/software/gdb/bugs/>.
Find the GDB manual and other documentation resources online at:
<http://www.gnu.org/software/gdb/documentation/>.
For help, type "help".
Type "apropos word" to search for commands related to "word"...
Reading symbols from ./app...done.
[New LWP 16425]
Core was generated by `./app'.
Program terminated with signal SIGSEGV, Segmentation fault.
#0  0x0000000000400837 in main () at ./myapp.c:67
67		*p=100;
(gdb) l
64
65		p=0x90;
66
67		*p=100;
68
69		printf("%d\n",z);
70		return 0;
71	}
(gdb)
The debugger reports the problem (SIGSEGV) and the address with the file and line number (myapp.c:67)
You can examine the registers (info registers) or the memory (x/20w $rsp) , see backtrace (bt) and more
Problems with the core dump
There are 2 main problems with the generated core dump:
- It can be very large if the program consumed a lot of memory before crashing. This is a problem while the core dump was generated on a client machine and we need to transfer it to the developer, it can also be a big problem if the storage is relatively small for example in embedded systems sometimes you have 1GB ram but only 256MB flash. Also sometimes the file system is read only (root file system on android smartphone)
- While we examine the core dump we can see only data relevant to the CPU. If for example we have hardware mapped on a virtual address, we can’t access those addresses using the core dump. In other words, the core dump records only the CPU and none of the other hardware registers (Fpga registers, …)
Writing Fault handler
To solve the above problems you can write a signal handler for some of the signals caused by errors:
void setHandler(void (*handler)(int,siginfo_t *,void *))
{
	struct sigaction action;
	action.sa_flags = SA_SIGINFO;
	action.sa_sigaction = handler;

	if (sigaction(SIGFPE, &action, NULL) == -1) {
		perror("sigfpe: sigaction");
		_exit(1);
	}
	if (sigaction(SIGSEGV, &action, NULL) == -1) {
		perror("sigsegv: sigaction");
		_exit(1);
	}
	if (sigaction(SIGILL, &action, NULL) == -1) {
		perror("sigill: sigaction");
		_exit(1);
	}
	if (sigaction(SIGBUS, &action, NULL) == -1) {
		perror("sigbus: sigaction");
		_exit(1);
	}

}
This helper function gets a function pointer and set it to be a signal handler for SIGSEGV(wrong memory address access), SIGFPE (floating point error, divide by zero), SIGILL (illegal instruction) and SIGBUS( bus error, accessing odd address)
Now lets write a simple handler and use it:
void fault_handler(int signo, siginfo_t *info, void *extra)
{
	printf("Signal %d received\n", signo);
	abort();
}


int main()
{
	int *p=NULL;

	setHandler(fault_handler);

	*p=100;
	return 0;
}
In this example we only print a message and abort but here we can dump whatever we like for example assume we already mapped a hardware region we can dump it
void fault_handler(int signo, siginfo_t *info, void *extra)
{
	int i;
	printf("Signal %d received \n", signo);
        for(i=0; i < hw_size ; i++)
           printf("HW regs[%d] = %x\n", i, hwmap[i]);
	abort();

}
You can also use the data provided in the siginfo_t parameter for example on SIGFPE you can find the address of the faulty instruction in:
printf("siginfo address=%x\n",info->si_addr);
Note that on SIGSEGV si_addr will be the faulty address (the address we tried to access – NULL in the above example)
The fault context
The most important thing about the fault handler is the 3rd parameter. In the prototype we declare it as void * but actually its type is ucontext_t. The reason that it declared as void * is because ucontext_t is architecture depended , You can find the structure in its header file and use it
For example if we want to print the Instruction Pointer register of the faulty instruction on x86 64 bit we write:
void fault_handler(int signo, siginfo_t *info, void *extra)
{
	ucontext_t *p=(ucontext_t *)extra;
	int val;
	printf("Signal %d received\n", signo);
	printf("siginfo address=%x\n",info->si_addr);

	val= p->uc_mcontext.gregs[REG_RIP];

	printf("address = %x\n",val);

	abort();

}
gregs array contains all general registers
We can use this method to access any register (RSP , RBP, RAX, …)
If we write this for ARM architecture its different:
void fault_handler(int signo, siginfo_t *info, void *extra)
{
	ucontext_t *p=(ucontext_t *)extra;
	int val;
	printf("Signal %d received from parent\n", signo);
	printf("siginfo address=%x\n",info->si_addr);

	val= p->uc_mcontext.arm_pc;

	printf("address = %x\n",val);

	abort();

}
Again we can access other registers this way : arm_sp , arm_lr, arm_r0 etc
See the header file of the required architecture for details
If we run the above code we get:
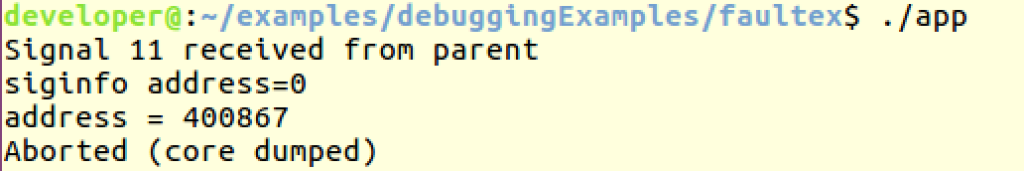
We can see that siginfo report the faulty address (NULL) but RIP value is 0x400867.
Now we can load the program into the debugger to see the address content:
use the list command with the address – (gdb) list *0x400867
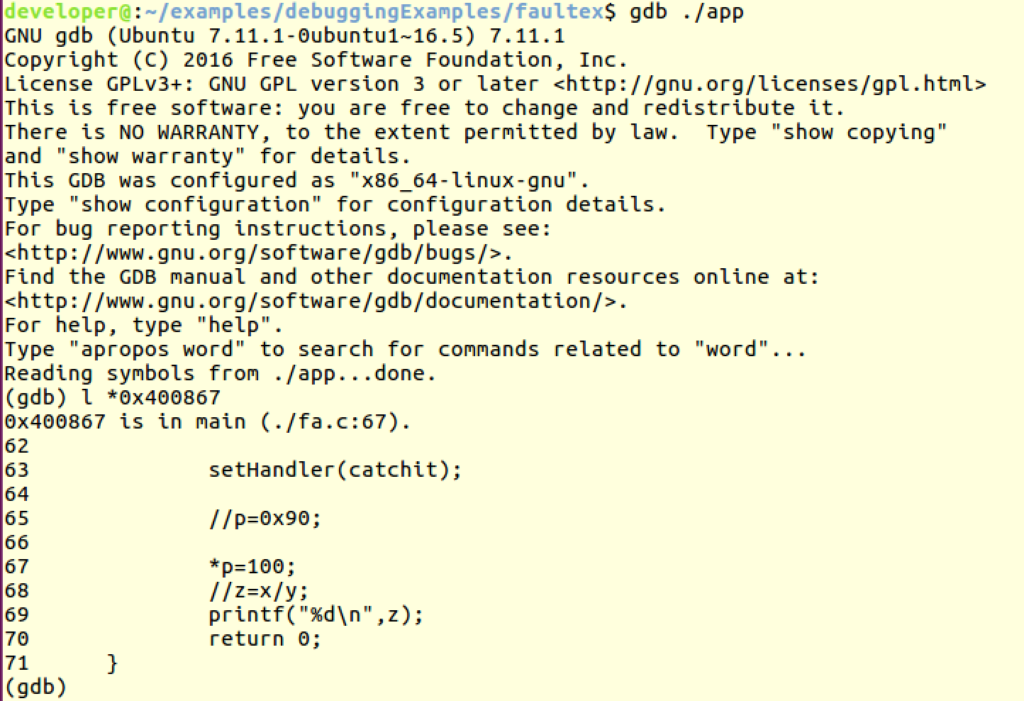
As you can see it points the faulty file and line number (fa.c:67)
Integrating with the core dump
If you just return from the fault handler it will be called again and again. thats why we need to call abort or exit at the end. The abort system call generate a core dump but it is generated from the signal handler context. One trick we can use is to set back the default signal handler – this will produce a core dump from the original fault point:
void fault_handler(int signo, siginfo_t *info, void *extra)
{
	ucontext_t *p=(ucontext_t *)extra;
	int x;
	printf("Signal %d received from parent\n", signo);
	printf("siginfo address=%x\n",info->si_addr);

	x= p->uc_mcontext.gregs[REG_RIP];

	printf("address = %x\n",x);

	setHandler(SIG_DFL);

}
The output now:
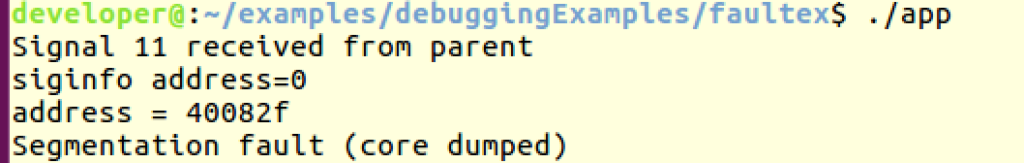
And the core dump was generated on the faulty line (and not by the abort.
TIP – Use LD_PRELOAD to load the handler to any compiled program
You can build the fault handler into a shared library and use the constructor to set it. Then you can inject the library to any process using LD_PRELOAD:
The code for the shared object:
#ifndef _GNU_SOURCE
#define _GNU_SOURCE
#endif
#include <unistd.h>
#include <signal.h>
#include <stdio.h>
#include <stdlib.h>
#include <sys/types.h>
#include <sys/wait.h>
#include <signal.h>

#include <sys/ucontext.h>
#include <ucontext.h>

static void __attribute__ ((constructor)) init_lib(void);

void setHandler(void (*handler)(int,siginfo_t *,void *))
{
	struct sigaction action;
	action.sa_flags = SA_SIGINFO;
	action.sa_sigaction = handler;

	if (sigaction(SIGFPE, &action, NULL) == -1) {
		perror("sigusr: sigaction");
		_exit(1);
	}
	if (sigaction(SIGSEGV, &action, NULL) == -1) {
		perror("sigusr: sigaction");
		_exit(1);
	}
	if (sigaction(SIGILL, &action, NULL) == -1) {
		perror("sigusr: sigaction");
		_exit(1);
	}
	if (sigaction(SIGBUS, &action, NULL) == -1) {
		perror("sigusr: sigaction");
		_exit(1);
	}

}

void catchit(int signo, siginfo_t *info, void *extra)
{
	ucontext_t *p=(ucontext_t *)extra;
	int x;
	printf("Signal %d received\n", signo);
	printf("siginfo address=%x\n",info->si_addr);

	x= p->uc_mcontext.gregs[REG_RIP];

	printf("address = %x\n",x);

	setHandler(SIG_DFL);

}


void init_lib()
{
	setHandler(catchit);
}
Compile it to a library:
# gcc -shared -o libFault.so ./fa_lib.c -fPIC
The application (without any handler):
#include <stdio.h>


int main()
{
	int x=9,y=0,z;
	int *p=NULL;

	*p=100;
	z=x/y;
	printf("%d\n",z);
	return 0;
}
Simple compile it:
# gcc -o appnosig ./example.c
Running it “as is”:
# ./appnosig
Segmentation fault (core dumped)
Inject the shared object:
# LD_PRELOAD=./libFault.so ./appnosig
Signal 11 received
siginfo address=0
address = 400548
Segmentation fault (core dumped)
On error resume next
In some cases we need our program to continue running even if we had a problem. We can handle this in some ways:
- Continue and never return from the fault handler
- Use execve(2) system call or one of its wrapper to call another main
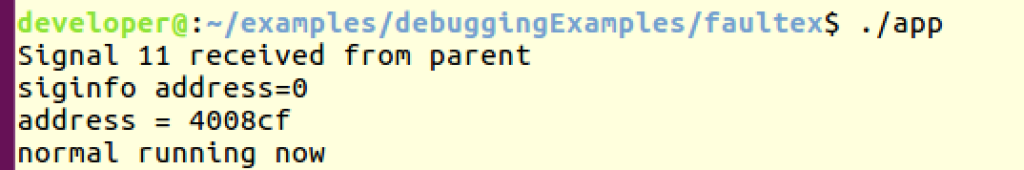
- Change the context instruction pointer to return to different code:
void continue_after_crash(void)
{
	printf("normal running now\n");
	exit(0);
}

void catchit(int signo, siginfo_t *info, void *extra)
{
	ucontext_t *p=(ucontext_t *)extra;
	int x;
	printf("Signal %d received from parent\n", signo);
	printf("siginfo address=%x\n",info->si_addr);

	x= p->uc_mcontext.gregs[REG_RIP];

	printf("address = %x\n",x);

	p->uc_mcontext.gregs[REG_RIP] = (unsigned int)continue_after_crash;

}
Output:
4. Jump over the faulty line – this is dangerous and very platform depended. You need to know how many bytes to jump for the next instruction. For example in ubuntu 64 bit:
void catchit(int signo, siginfo_t *info, void *extra)
{
	ucontext_t *p=(ucontext_t *)extra;
	int x;
	printf("Signal %d received from parent\n", signo);
	printf("siginfo address=%x\n",info->si_addr);

	x= p->uc_mcontext.gregs[REG_RIP];
//	x= p->uc_mcontext.arm_pc;

	printf("address = %x\n",x);

	p->uc_mcontext.gregs[REG_RIP] += 6;
	//setHandler(SIG_DFL);
	//p->uc_mcontext.gregs[REG_RIP] = (unsigned int)continue_after_crash;
	//abort();

}


int main()
{
	int x=9,y=0,z=10;
	int *p=NULL;

	setHandler(catchit);


	*p=100;
        printf("Alive ??? \n");
	z=x/y;
	printf("%d\n",z);
	return 0;
}
Output:
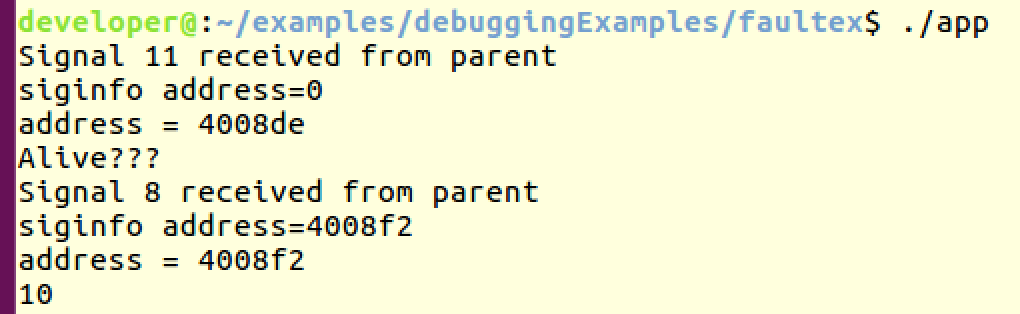
As you can see from the output , the program jumped over the null pointer assignment and the divide by zero. Not so useful but possible.
You can see the full code example here
4 thoughts on “Linux – Writing Fault handlers”
Comments are closed.
[…] you write fault handlers in your code and the program crashed, the faulty address is printed to the […]
THank you for this great article. Can you tell us more about Possible security issues in relation to “On error resume next” part when jumping to next instruction ?
Useful article! Especially liked how you provided transcending snippets of code all the way to resuming at a function.
tried the suggested solution, but I see that p->uc_mcontext.arm_pc is giving different output on every run.
if I run the program with gdb and check info registers I see the correct PC (and it never changes).
any idea why arm_pc is not consistent on every run?