Embedded Linux development is a complex task. You need tools on the target and the host and its important to setup everything so we can build and debug easily.
Let go over the process. You can do it yourself , just build an Embedded Linux system with QEMU
Building For The Target
To build code for the target we need a cross toolchain and to build the code add debugging information:
Lets start with a simple code example:
#include<stdio.h>

int add(int a, int b)
{
	int c;
	c=a+b;
	return c;
}

int getnum(int num)
{
	int i;
	i=add(num,90);
	return i+100;
}

void main()
{
	int res=0;
	res+=10;
	res = getnum(res);
	printf("res= %d\n",res);
}
Compile it for the target with debugging information:
# arm-none-linux-gnueabi-gcc -g3 -o app ./simp.c
You don’t need the debugging information on the target so let strip the target executable
# arm-none-linux-gnueabi-strip -s -o app4target ./app
Copy app4target to the target file system
Debugging with GDB Server
To debug the code we need gdbserver on the target. gdbserver is a simple agent that the real GDB debugger can connect and interact with. We can use networking or serial port to connect the client and the server
on the target run:
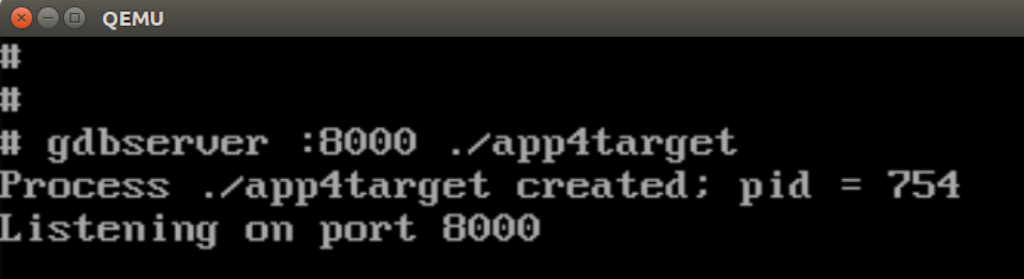
# gdbserver :8000 ./app4target
gdbserver runs the executable and suspend it
on the host run cross GDB debugger and load the version with the debugging information
# arm-none-linux-gnueabi-gdb ./app
On GDB session connect to the target, set a breakpoint in the main function and continue running
(gdb) target remote 192.168.0.2:8000

Remote debugging using 192.168.0.2:8000
warning: Unable to find dynamic linker breakpoint function.
GDB will be unable to debug shared library initializers
and track explicitly loaded dynamic code.
0x76fd7d20 in ?? ()

(gdb) b main
Breakpoint 1 at 0x8590: file ./simp.c, line 22.

(gdb) c
Continuing.
warning: Could not load shared library symbols for 3 libraries, e.g. /lib/libgcc_s.so.1.
Use the "info sharedlibrary" command to see the complete listing.
Do you need "set solib-search-path" or "set sysroot"?

Breakpoint 1, main () at ./simp.c:22
22		int res=0;
From this point you can continue with GDB , you will get the information from the target for example inspect the target CPU registers
(gdb) info registers
r0             0x1	1
r1             0x7efffe44	2130705988
r2             0x7efffe4c	2130705996
r3             0x8584	34180
r4             0x0	0
r5             0x0	0
r6             0x83e4	33764
r7             0x0	0
r8             0x0	0
r9             0x0	0
r10            0x76fff000	1996484608
r11            0x7efffcf4	2130705652
r12            0x76faa000	1996136448
sp             0x7efffce8	0x7efffce8
lr             0x76e86264	1994941028
pc             0x8590	0x8590 <main+12>
cpsr           0x60000010	1610612752
Working with shared objects
You probably noticed the warning message about shared libraries we get while we connect to the target. To debug also shared objects, we need to set some options:
First lets build the library and the client
mylib.c
#include<stdio.h>


void f2()
{
printf("X");
}

void f1()
{
	int i;
	for(i=0;i<100;i++)
		f2();
}

void f3()
{
f1();
printf("hello %d\n",100);
}
build the library with debugging information:
# arm-none-linux-gnueabi-gcc -shared -g3 -o libMyTest.so mylib.c -fPIC
usemylib.c
#include<stdio.h>

void f1();

void main()
{
f1();
}
build the client with debug info
# arm-none-linux-gnueabi-gcc -g3 -o app1 usemylib.c -L. -lMyTest
you can strip the target binaries, copy the library to /mylibs on the target file system
Run the gdbserver and load the client
# gdbserver :8000 ./app1
Start the gdb client and before connecting to the target set the following 2 variables:
(gdb) set solib-absolute-prefix /dev/null
(gdb) set solib-search-path /home/developer/armsystem/outfs/lib:/home/developer/armsystem/outfs/usr/lib:/home/developer/armsystem/outfs/mylibs
Add all the shared libraries locations to solid-search-path variable
Now you can also debug the shared object initializers for example if we add the following code to the shared library:
static void __attribute__ ((constructor)) \
  lib_init(void);

static void lib_init(void) {

  printf("Library init. \n");

  return;
}
Now connect to the target and add a breakpoint in lib_init:
(gdb) b lib_init
Function "lib_init" not defined.
Make breakpoint pending on future shared library load? (y or [n]) y
Breakpoint 1 (lib_init) pending.
(gdb) b main
Breakpoint 2 at 0x866c: file usemylib.c, line 7.
(gdb) c
Continuing.

Breakpoint 1, lib_init () at mylib.c:8
8	  printf("Library init. \n");
Using GDB server in Multi-Process mode
You can run GDB server without specifying a process to load with –multi option. You can select which process to load via gdb client for example if we have 2 different apps:
#include<stdio.h>

void main()
{
	int res=0;
	res+=10;
	printf("app1 res= %d\n",res);
}
Compile both apps and copy to the target
Run gdbserver on the target with –multi option:
# gdbserver --multi :8000
On the host run cross gdb without loading any ELF file and connect to the target using extended-remote:
(gdb) target extended-remote 192.168.0.2:8000
Remote debugging using 192.168.0.2:8000
To load the file to debug on the target and host run the following commands :
(gdb) set remote exec-file apptest1
(gdb) file ./apptest1
Reading symbols from ./apptest1...done.
Now add a breakpoint and run the remote process:
(gdb) b main
Breakpoint 1 at 0x8524: file ./apptest1.c, line 5.
(gdb) r
Starting program: /home/developer/examples/debuggingExamples/debugtests/apptest1

Breakpoint 1, main () at ./apptest1.c:5
5		int res=0;
To load a new process to debug:
(gdb) set remote exec-file apptest2
(gdb) file apptest2
Load new symbol table from "apptest2"? (y or n) y
Reading symbols from apptest2...done.
(gdb) b main
Note: breakpoint 1 also set at pc 0x8524.
Breakpoint 2 at 0x8524: file ./apptest2.c, line 5.
(gdb) r